Meme Coin Portfolio Risk: Why Eight Coins Are Often One Bet (2026)
By the founder · Published 2026-07-05
Meme coin portfolio risk is bigger than it looks: eight meme coins usually move as one sentiment bet. Check yours free in 60 seconds, no wallet connection.
Meme coin portfolio risk is the chance that your entire meme sleeve behaves as a single bet on sentiment, not as the collection of separate positions it appears to be. Owning eight different meme coins feels diversified, but if they all pump and dump on the same wave of attention, you effectively hold one concentrated position wearing eight tickers. This guide shows how to see that clearly, how to size meme exposure on purpose, and how to stress test a meme-heavy book with real numbers.
The short answer
The problem with meme coins is rarely that any single one is bad. It is that they tend to be correlated, thinly traded, and prone to brutal drawdowns at the same moment. A basket of eight memes riding the same cycle is closer to one bet than to eight independent ones. So the honest question is not how many meme tickers you hold, but how many independent bets you actually have. For a lot of meme bags, the answer is one or two.
Why coin count is not diversification
Diversification only helps when assets do not move together. Meme coins usually do move together, because they run on the same fuel: social attention, a trending narrative, and a burst of new buyers. When that attention fades, it fades for the whole category at once. The chart below sketches how risk tends to climb as you move up from large-cap coins into the meme tier.
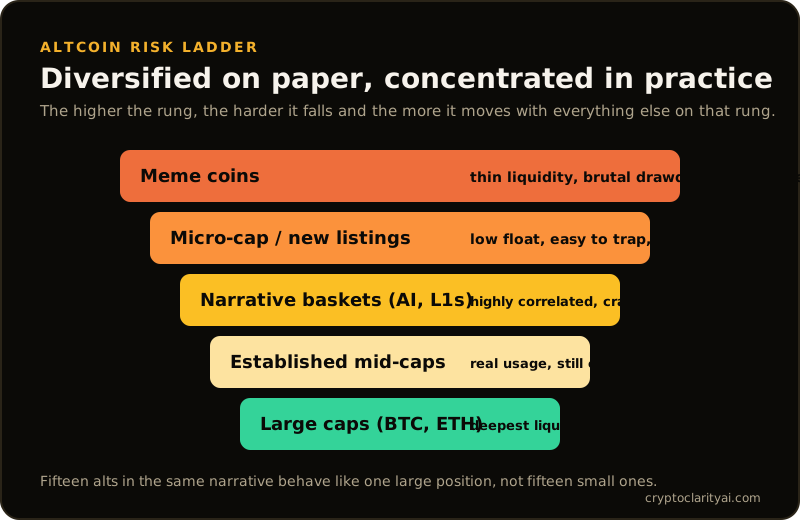
The three risks stacked into meme coins
- Correlation: memes rise and fall on shared sentiment, so they do not cushion each other in a drawdown. Eight of them can red at once.
- Liquidity: many trade thin, so a large sell order moves the price against you before it fills. A paper gain can shrink the moment you try to exit at size.
- Drawdown and delisting history: the meme tier has a long record of 80 to 90 percent falls, tokens that never recover, and projects that get delisted or rugged entirely. The downside is not symmetric with the upside.
Spotting false diversification inside the meme sleeve
Here is where people fool themselves. Suppose you hold eight meme coins and feel spread out. Now group them by what actually drives their price: the chain they live on, the narrative they belong to, and the crowd that trades them. If six of the eight are dog-themed tokens on the same chain that all trend on the same days, they are not six bets. They are one bet with six labels.
A quick self-check: look at the last time the meme category dumped. Did most of your bag fall together on the same day? If yes, your effective number of independent bets is far lower than your ticker count suggests. That is the same false diversification that shows up across altcoin portfolio risk more broadly, only sharper, because memes cluster harder than most alts.
A worked stress test of a meme-heavy book
Numbers make this concrete. Suppose a $20,000 portfolio built like this: 60 percent, or $12,000, spread across eight meme coins; 25 percent, or $5,000, in SOL; and 15 percent, or $3,000, in stablecoins. It looks like ten positions with a cash buffer.
Now run a sentiment flush. Say the meme category drops 70 percent together. Your $12,000 becomes $3,600, a loss of $8,400. SOL often moves with the risk-on crowd, so say it falls 45 percent, turning $5,000 into $2,750. The stablecoins hold at $3,000. Your total lands near $9,350, down from $20,000. That is roughly a 53 percent hit, and almost all of it came from a meme sleeve that only ever behaved as one position.
Compare that to a deliberately sized version. Suppose the same $20,000 held 40 percent BTC ($8,000), 25 percent ETH ($5,000), 20 percent stablecoins ($4,000), and just 15 percent, or $3,000, split across three uncorrelated memes. In the same 70 percent meme flush the meme slice drops to $900, a $2,100 loss. Even if BTC and ETH each slip 30 percent, the total sits near $13,800, down about 31 percent. Same market, very different damage, because the losable slice was sized like a losable slice. This is the kind of side by side a crypto stress test runs automatically across several crash depths at once.
Liquidity: the risk that only shows up when you sell
Correlation hurts on the way down, but liquidity is what turns a paper loss into a realized one. Suppose one of your meme positions reads $8,000 on screen, but the token trades only a few hundred thousand dollars of real volume a day. Trying to sell $8,000 into that can push the price down several percent as your order fills, and in a panic, when everyone exits at once, the slippage is worse. The screen value assumes a buyer who may not be there. That gap between quoted value and exit value is why liquidity gets scored on its own.
How to size meme exposure on purpose
Meme coins are not automatically off-limits. The workable approach is to treat them as a small, fully losable slice around a stronger core, and to decide the size before you buy, not after a green week tempts you to add. Suppose you run a $50,000 book and cap memes at 5 percent, or $2,500. If that slice goes to zero, it stings but does not change your life. If it runs, the upside still moves your total in a real way. The point is that the number is chosen deliberately, and you can see how it shifts your overall risk. Measuring how one sleeve dominates the whole is exactly what a concentration calculator is built to surface.
This is educational information about portfolio structure, not financial advice.
Turn it into one number
Doing all of this by hand is tedious and easy to fudge in your own favor. That is the point of a single risk score: it measures your meme weight, your effective number of independent bets after correlation, your per-position liquidity, and your drawdown exposure, then rolls the whole book into one 0 to 100 score with a plain-language label. You enter your holdings by hand. No wallet connection, no seed phrase, no exchange login.
You can run that full score for free, with no signup, in the live demo. Type in your holdings, get your score, and see whether your meme sleeve is one bet or several. If the score comes back healthy, you are done. If it flags a concentrated sentiment bet, the $19 $12 lifetime unlock opens your full correlation map, your per-position liquidity and drawdown flags, and a prioritized plan to trim the riskiest exposure. One-time payment, lifetime access, and you can re-run it any time your holdings change.
The takeaway
A pile of meme tickers is not diversification if they all move on the same sentiment. Group your memes by chain, narrative, and crowd to find your true number of bets, size the sleeve as a small losable slice, and stress test it against a real flush before the next one arrives. Risk you can see is risk you can manage.
Run your free score now in the demo.
Frequently asked questions
- Are meme coins more correlated than they look?
- Usually yes. Most meme coins pump and dump on the same wave of sentiment, so eight of them often behave like one or two independent bets rather than eight. When the mood turns, they tend to fall together, which is the opposite of diversification.
- How much of a portfolio should be meme coins?
- There is no single right number, but many holders treat memes as a small, losable slice around a core rather than the core itself. A common approach is a few percent you are fully prepared to lose. The tool shows your meme weight and how it moves your overall risk score.
- Why are meme coins hard to sell at size?
- Many carry thin liquidity, so a large sell order pushes the price down against you before it fills. A position that looks worth a lot on screen can be worth much less once you actually try to exit, which is why liquidity is flagged separately from price.
- How do I check my meme coin risk for free?
- Enter your holdings in the demo and get a free 0 to 100 risk score across all 12 dimensions in about 60 seconds, with no wallet connection or signup. The full correlation map and fix-it plan unlock with a one-time 19 dollar payment for lifetime access.
Run your free score and see whether your meme bag is really one bet.
Free portfolio health score across 12 dimensions. No signup. Real fund-style math on your holdings.
